In the record books, the U.S. national debt surged by $473 billion in just three weeks to $35.8 trillion. That’s roughly $103,700 in debt per American citizen. The rapid rise in debt raises concerns about its sustainability, amid fears from some that the country is on a path toward economic instability or bankruptcy if it continues at this pace.
This message flags the ever-growing financial burden on the U.S. government and also that burden on the economy as a whole.
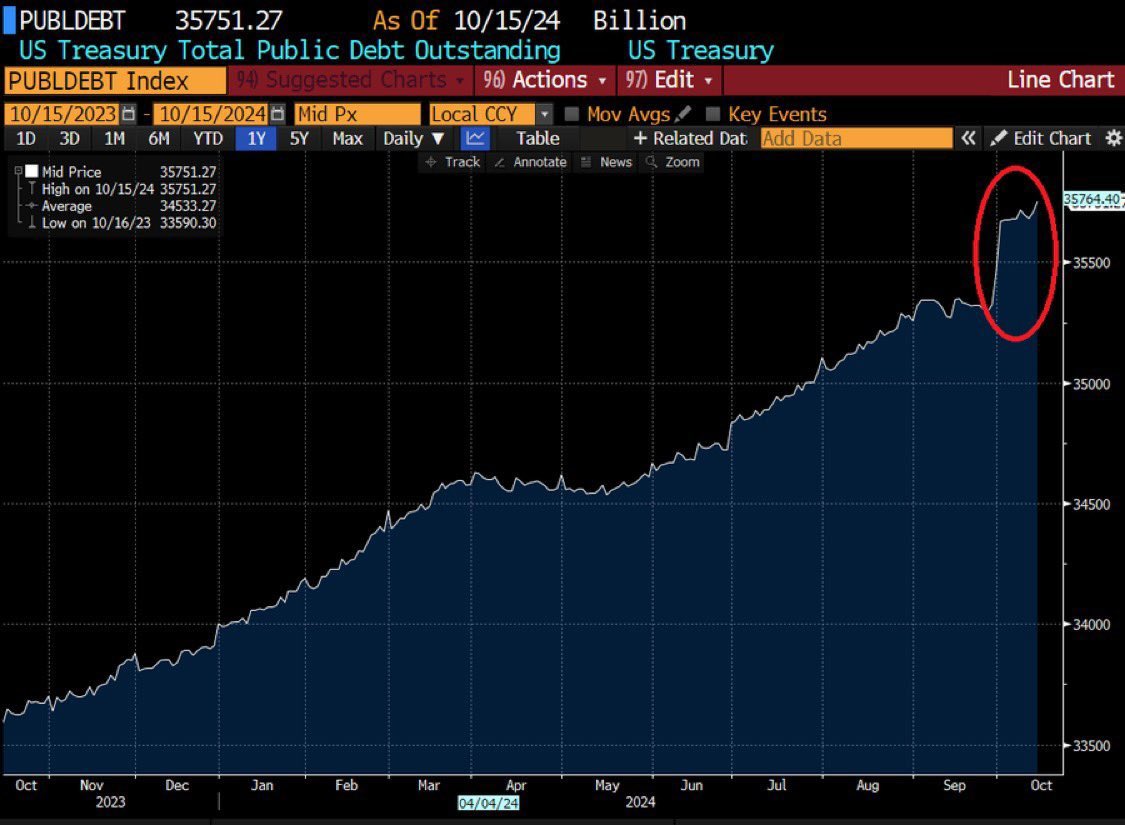
This chart depicts the U.S. Treasury’s Total Public Debt Outstanding as of October 15, 2024. From this, it is quite evident that over one year, the government debt has considerably gone up. The value of the debt today reads 35,751.27 billion USD, and it has risen gradually, with a steep upward trend in September-October 2024, showing a sudden spurt in public debt issuance.

Key Data Points:
Debt Currently (as of October 15, 2024): 35,751.27 billion USD
Highest Value: $35,751.27 billion (October 15, 2024)
Lowest Value: $33,590.30 billion (October 16, 2023)
Average Debt for the Year: $34,533.27 billion
Also Read:
Trend Overview:
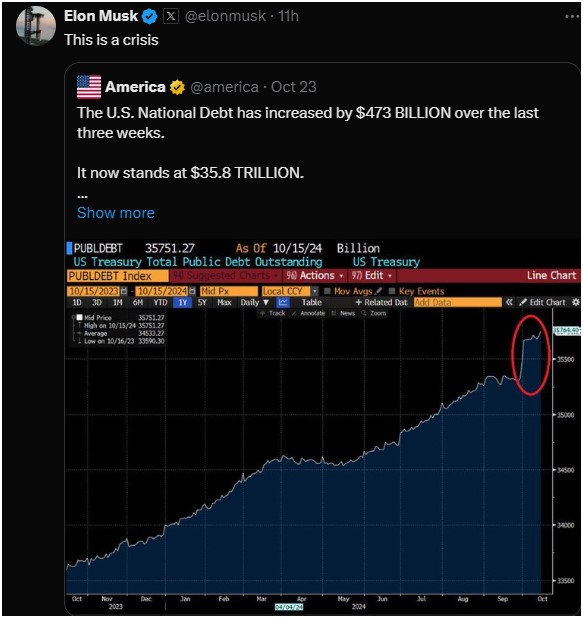
This chart depicts a slow rise of the U.S. public debt from October 2023 to October 2024. The debt has been on the rise from October 2023 up to mid-2024 at a steady pace, which indicates normal government borrowing for financing its expenditures. This post is also shared by Elon Musk.
The U.S. National Debt has increased by $473 BILLION over the last three weeks.
It now stands at $35.8 TRILLION.
That’s $103,700 of debt for every American.
This is unsustainable.
America is in the fast lane to bankruptcy. pic.twitter.com/VrEDutmVin
— America (@america) October 22, 2024
The sharp upsurge in debt, starting from September 2024. It is circled in red in this chart, is the most striking feature of it. Such a sudden spike in debt surely indicates an extraordinary surge in government borrowings or new debt issues within a short period.
Possible Causes of the Spike:
Indeed, the sudden spike of debt may be from several factors, which might entail:
- Increased fiscal spending-which could be emergency programs by the government, stimulus packages, or infrastructure investment.
- Readjustments in the debt ceiling, enabling the government to borrow more.
- Economic policies to stimulate the economy, such as increased military expenses or disaster relief efforts.
The chart insinuates that, alone in the last quarter of 2024, fiscal activities by the U.S. government remarkably enlarged the national debt-a key worry for economists and policy thinkers alike.
Conclusion:
This chart illustrates the continually growing burden of U.S. public debt, with tremendous growth in recent periods. It may suggest a forthcoming financial correction or seminal economic event. Understanding what drives this increase will help deduce the fiscal health of the economy and the wide-ranging implications this may portend.

